- Research article
- Open access
- Published:
Improved selection of participants in genetic longevity studies: family scores revisited
BMC Medical Research Methodology volume 21, Article number: 7 (2021)
Abstract
Background
Although human longevity tends to cluster within families, genetic studies on longevity have had limited success in identifying longevity loci. One of the main causes of this limited success is the selection of participants. Studies generally include sporadically long-lived individuals, i.e. individuals with the longevity phenotype but without a genetic predisposition for longevity. The inclusion of these individuals causes phenotype heterogeneity which results in power reduction and bias. A way to avoid sporadically long-lived individuals and reduce sample heterogeneity is to include family history of longevity as selection criterion using a longevity family score. A main challenge when developing family scores are the large differences in family size, because of real differences in sibship sizes or because of missing data.
Methods
We discussed the statistical properties of two existing longevity family scores: the Family Longevity Selection Score (FLoSS) and the Longevity Relatives Count (LRC) score and we evaluated their performance dealing with differential family size. We proposed a new longevity family score, the mLRC score, an extension of the LRC based on random effects modeling, which is robust for family size and missing values. The performance of the new mLRC as selection tool was evaluated in an intensive simulation study and illustrated in a large real dataset, the Historical Sample of the Netherlands (HSN).
Results
Empirical scores such as the FLOSS and LRC cannot properly deal with differential family size and missing data. Our simulation study showed that mLRC is not affected by family size and provides more accurate selections of long-lived families. The analysis of 1105 sibships of the Historical Sample of the Netherlands showed that the selection of long-lived individuals based on the mLRC score predicts excess survival in the validation set better than the selection based on the LRC score .
Conclusions
Model-based score systems such as the mLRC score help to reduce heterogeneity in the selection of long-lived families. The power of future studies into the genetics of longevity can likely be improved and their bias reduced, by selecting long-lived cases using the mLRC.
Background
There is strong evidence that longevity, defined as survival to extreme ages, clusters within families and is transmitted across generations [1,2,3,4,5,6,7]. Recent research [5] on two large population-based multi-generational family studies indicates that longevity is transmitted as a quantitative genetic trait. Moreover, associations between environmental factors and familial clustering have been rarely found using historical pedigree data [5, 8,9,10]. Although these findings suggest that human longevity has a genetic component, genetic studies on longevity have had limited success in identifying longevity loci [11,12,13,14,15,16,17]. One of the main causes for this limited success could be the large heterogeneity in criteria for participant selection in longevity studies [5, 18, 19]. Since the study participants must be alive to extract blood or other biomaterials their longevity phenotype is, by definition, unknown. An additional complication of longevity studies is the ongoing increase in life expectancy due to non-genetic factors [20], such as improvements in nutrition, life style and health care. If only individual age is considered as selection criterion, these non-genetic factors increase the risk of including sporadically long-lived individuals i.e. individuals with the longevity phenotype but who do not have an underlying genetic predisposition for longevity.
To obtain a sample with less phenotype heterogeneity, the family history of longevity can be used as a participant selection criterion [5, 18]. Although this approach does not avoid that sample selection is influenced by family-shared non-genetic factors potentially involved in longevity, it is likely that it increases the power in case-control studies to detect novel genetic loci [21, 22]. A natural way to incorporate family history in the study design is to develop a longevity family score to identify families with the heritable longevity trait and to subsequently select alive members of these families for (genetic) longevity studies. A number of longevity family scores have been previously proposed [4, 18, 23,24,25], using different definitions of individual longevity and different ways of summarizing longevity within families. The implications of these choices are not well understood, namely how the interplay among individual longevity definition, family-specific summary measures and family size affects the sample selection process based on longevity family scores. The first challenge when developing longevity family scores is defining individual longevity. It is unclear how extreme the age at death must be to label an individual as long-lived and which scale is most beneficial so that scores reflect differences in extreme survival and not just in overall lifespan. The second challenge when developing longevity family scores are the large differences in family size. These differences imply that the available information per family differs. For a family with 12 members, for instance, more information is available than for a family with 2 members only. Importantly, we typically do not know whether these differences are real differences in sibship sizes or the result of missing data caused by limitations of the data collection. If not properly addressed, differences in family size can lead to biased rankings of long-lived families. This can lead to an increased heterogeneity among selected participants in longevity studies and hence reduce power of analyses. Instead of studying the genetics of longevity, biased selections can potentially lead to the combined analysis of the genetics of longevity, fertility and other factors affecting family size, such as, for example, socio economic status. Up till now, this important challenge has not received enough attention and how to address this problem still remains open.
In this paper, we investigate to what extent existing longevity family scores such as the Family Longevity Selection Score (FLoSS) [23] and the Longevity Relatives Count (LRC) score [18], are affected by differential family size. Subsequently, we propose an alternative method based on mixed effects regression modelling to deal with differences in family size when building a longevity family score.
The main novelty of our new approach is to consider the family size as a source of uncertainty when estimating the level of longevity of a family. Hence, we propose to select families accounting for such estimated uncertainty. This new approach will contribute to more robust scores and selection rules in longevity studies.
Methods
Existing longevity family scores and family size
Several longevity or excess survival family scores have been previously proposed [4, 18, 23,24,25]. Often, to measure individual survival exceptionality, age at death is transformed to the corresponding survival percentile [18] or related measure such as the cumulative hazard [4, 23, 25] using life table data of a reference population, typically matching for sex and birth cohort. An alternative approach based on defining individual survival exceptionality as the difference between individual’s age at death and the sample-based expected age at death correcting for a number of confounders has been also proposed [24].
We focus on two of the previous proposals, representative of two different ways of summarizing individual survival exceptionality within families: the Family Longevity Selection Score (FLoSS) [23] and the Longevity Relatives Count (LRC) score [18]. The FLoSS relies on a sum to summarize survival exceptional within families, while the LRC score is representative of the rest of previously proposed longevity scores which all rely on an empirical expectation as summary, i.e., the mean [4, 24, 25] or a proportion [18] depending on the nature of the individual measure of survival exceptionality. These two type of summary measures (sum versus empirical expectation) have different implications with regard to the influence of family size in the resulting scoring system.
The FLoSS favors large families
The Family Longevity Selection Score (FLoSS) [23] was constructed using siblings included in the Long Life Family Study. The FLoSS is a modification of the SEf score which adds a bonus for the presence of living family members. Since the main properties of SEf transfer to FLoSS, for the sake of simplicity we focus on the properties of the SEf, defined, for each family i, as follows:
where tij is the age at death of family member j of family i, with j = 1,…,Ni members, S(tij| bcij, sexij) is the survival probability at age tij given sex and birth cohort in the reference population and Λ(tij| bcij, sexij) is the corresponding cumulative hazard. SEij varies between − 1 (if S(tij| bcij, sexij) = 1) and ∞ (if S(tij| bcij, sexij) = 0). The maximum value of SEij is determined by the maximum age recorded in the used life table. If for example, this maximum age at death is 99, like in the Dutch life tables [26], and the minimum survival in the population is S(99| bcij, sexij) = 0.01, this provides a maximum SEij = 4.6. The reference value, corresponding to a value SEij = 0 corresponds to S(tij| bcij, sexij) = 0.37. This means that family members with age at death beyond the top 37% survivors count positively in the score and those with younger ages at death count negatively. For example, using the Dutch life tables, this cut-off would correspond, for those born around 1900 with an age of death of around 73 years for men and of around 80 for women. This thresholds are not in line with recent evidence indicating that higher ages at death need to be considered to capture the heritable longevity trait [5, 18]. This problem can be solved by conditioning survival to being alive at certain age. For example, a conditioning age of 40 years has previously been proposed [23], which increases the age cut-off associated to SEij = 0. For example, using Dutch lifetables this would correspond to a cut-off of around 84 years for women and 78 year for men for individuals born around 1900. These ages correspond with percentiles survivals at birth of around 0.28 (oldest 28% survivors of their birth cohort) which are likely not extreme enough to capture the heritable longevity trait. This drawback is somehow compensated by the strongly skewed distribution of SEij, meaning that the impact of increasing, for example, from 95 to 96 years is greater than the increase from 70 to 71.
An additional problem of the SEf score is that it uses the sum over the available family members to summarize the level of survival exceptionality within the family. This implies that large families are systematically overweighted when using SEf. This phenomenon is illustrated in Fig. 1. Three example populations with twenty sibships each and different level of enrichment for longevity are considered. In the three examples, we consider sibships of increasing size, Ni = i + 1, i = 1,2,...,20. In the first example population, all sibships have two siblings belonging to the top 5% survivors of their sex-specific birth cohort and the rest of siblings belonging to the top 30% survivors, so these family members are clearly not long-lived. In the second, all sibships have two siblings belonging to the top 10% survivors of their sex-specific birth cohort and the rest of siblings belonging to the top 30% survivors. In the third example population all siblings belong to the top 30% survivors, representing a population with no long-lived individuals. The left panel of Fig. 1 illustrates the performance of the score SEf in these three examples. Overall, increasing the sibship size leads to larger values of SEf. Moreover, larger families with lower proportions of long-lived members can present a larger value of SEf than small families with a larger proportion of long-lived members. For example, a family with two members belonging to the top 10 survivors and 8 extra not long-lived siblings has a larger SEf than a family with two members in the top 10 survivors and 5 extra not long-lived siblings (black line). It can also happen that a large family where two siblings are top 10% survivors and the rest not long-lived present a larger SEf than a smaller family where two siblings are top 5% and the rest are not long-lived. The increasing pink line corresponding to the third scenario illustrates that large families with no long-lived family members can present large values of SEf, with SEf arbitrarily increasing in parallel to family size.

Example of three hypothetical populations with 20 sibships with sizes Ni = 2,3,...,21. In each population families are ranked according to SEf (left panel) and LRC (right panel). The black lines represents a population in which all families have two siblings belonging to the top 5% survivors (long-lived) of their sex-specific birth cohort and the rest of siblings belonging to the top 30% survivors (not long-lived). The blue lines represent a population in which all families have two siblings belonging to the top 10% survivors (long-lived) of their sex-specific birth cohort and the rest of siblings belonging to the top 30% survivors. The pink lines represent a population composed of families with all family members not log-lived, belonging to the top 30% survivors. The left panel shows the value of SEf with increasing number of non-lived family members. The right panel shows the value of LRC with increasing number of non-lived family members. Because of the definition of LRC, black and blue lines coincide in the right panel
In summary, using SEf and FLoSS in the selection of long-lived families may lead to an overrepresentation of large families and hence undesirable heterogeneity in the selected sample of families. Importantly, the size of the families governs the range of variation of the family score implying that SEf and FLoSS are not comparable when calculated in populations with different underlying family size patterns. Since this is an highly undesired feature, we will not further focus on the SEf score (and FLoSS) in the rest of the paper.
The LRC score favors small families
To mitigate the previously explained bias towards large families, a solution is to use a different summary measure at the family level, like the average [4, 25].
In this line, and based on the results of a recent study which shows that longevity is heritable beyond the 10% survivors of their birth cohort [5], the Longevity Relatives Count (LRC) score has been proposed [18]. The original definition of the LRC score allows for the inclusion of family members with different degree of relatedness. Here, we focus on its simplest form considering only siblings in its construction:
where Pij is the sex and birth cohort specific percentile survival of individual j of family i, i.e., Pij = 1 − S(tij| bcij, sexij). I(Pij ≥ 0.9) is a variable indicator taking value 1 if individual j belongs to the top 10 survivor of his/her sex-specific birth cohort and 0 otherwise. As a result, LRCi is the proportion of members of family i belonging to the group of top 10 survivors, defined as long-lived. The LRC is bounded between 0 and 1, providing a clear interpretation and comparability across populations. A drawback is that it is based on a binary definition of longevity, ignoring differences in longevity beyond the top 10% of survivors.
The LRC score is based on calculating a proportion, and as a consequence, the resulting ranking based on this score indirectly favors small families. For small families, it is more easy to have 100% of its family members in the top 10% survivors for than large families. Hence, in small families it can be questioned whether a large LRC truly captures the heritable longevity trait.
The problem of this approach is of different nature than the case of the SEf score. While adding not long-lived family members implies an increase in SEf, this is not the case for LRC (Fig. 1, right panel). Instead of a systematic bias, we now face a problem of different uncertainty levels depending of the size of the family which cannot be properly captured by an empirical proportion. Consider the following example for illustration. Two families, both with half of the siblings long-lived, but in the first case the sibship size was 2 and on the second case the sibship size was 10. It is clear that there is more information in the second case and hence the ranking should also take this into account. However, using empirical proportions small families are benefitted.
Accounting for uncertainty in longevity family scores
To deal with the heterogeneity in information between families caused by their size, we propose to use mixed effects regression modelling in the estimation of family scores. In particular, we focus on the LRC, and extend its concept by introducing family specific random effects.
Let Yij = I(Pij ≥ c) be a binary random variable that indicates if Pij is equal of larger than c, where Pij is the percentile survival of individual j of family i, and c is a pre-specified threshold of longevity. For example, c = 0.90. Let ui be a random effect shared by the members of the same family that reflects the unobserved factors contributing to longevity.
Assuming that Yij follows a Bernoulli distribution, the family specific probability to reach c is given by the following logistic regression model with random intercept:
We assume that ui follows a normal distribution with mean zero and variance σ2. Then, the parameters β0 and σ2 can be estimated maximizing the resulting likelihood function \( \prod \limits_{i=1}^N{L}_i\left({\beta}_0,\sigma \right)=\int \prod \limits_{j=1}^{N_i}P{\left({Y}_{ij}=1|{u}_i\right)}^{y_{ij}}{\left(1-P\left({Y}_{ij}=1|{u}_i\right)\right)}^{\left(1-{y}_{ij}\right)}f\left({u}_i;{\sigma}^2\right)d{u}_i \), where N is the total number of families, Ni is the number of family members of family i and f is the density function of ui. Maximization of the likelihood cannot be analytically solved and requires numerical approximation techniques (e.g. quadrature methods).
Finally, we can obtain \( {\hat{p}}_i \), the expected value of pi given the observed data of family i and the estimated β0 and σ, denoted by \( {\hat{\beta}}_o \) and \( \hat{\sigma} \), as
where \( f\left(u|{y}_{i1},\dots, {y}_{i{N}_i},{\hat{\beta}}_0,\hat{\sigma}\right) \) is the density of the posterior distribution of the family specific random effect. Using Bayes’ rule, this density can be obtained as
where \( f\left({y}_{i1},\dots, {y}_{i{N}_i}|{\hat{\beta}}_0,u\right)=\prod \limits_{j=1}^{N_i}P{\left({Y}_{ij}=1|{u}_i\right)}^{y_{ij}}{\left(1-P\left({Y}_{ij}=1|{u}_i\right)\right)}^{\left(1-{y}_{ij}\right)} \).
We propose to consider \( {\hat{p}}_i \) as a new longevity family score of family i, and we denote it by mLRCi. In this way, mLRC can be regarded as a model-based version of LRC which includes shrinkage based on Ni. mLRCi can still be interpreted as the proportion of long-lived members of family i but it captures the uncertainty due to family size by the different ‘weight’ each family receives through its estimated random effect \( {\hat{u}}_i \).
Software implementation
The new mLRC family score, together with the LRC and FLoSS have been implemented in R. The code is provided as supplementary material.
Results
Simulation study
Simulated data is generated under the assumption that a latent factor, shared by the members of the same family, controls the degree of longevity of the family. Based on the simulated data, we can measure the level of agreement between the underlying longevity factor and different longevity family scores.
Characteristics of the simulated datasets such as the number and size of the families are chosen to mimic our real data set. In each run of the simulation, we simulated N = 1000 families of different sizes, namely 200 families with respectively size 2,3,8,10, and 14 individuals. For each individual j of family i, where i = 1,...,N, we sampled survival percentiles pij from a beta distribution with parameters a = exp.(0.1) and b = a × exp.(−(1 + ui)), where ui was a random effect common to the Ni members of family i. The random effect was sampled from a normal distribution with mean 0 and standard deviation 2. Large values of ui decreased the survival percentile pij, which meant that the families with the lowest values of the random effect were the most enriched for longevity.
For each family, we computed the LRC score and the new model-based LRC (mLRC). Both scores were compared in terms of their relation with family size and performance as selection tools. The simulation was repeated 1000 times.
Table 1 shows the distribution of family size according to the values of LRC and mLRC. The LRC score is strongly affected by family size; families with low sibship sizes tend to have large values of LRC (left column of Table 1). No clear relation between family size and mLRC is observed (right column of Table 1), which is in agreement with the data generation mechanism. Figure 2 shows the comparison between the LRC and mLRC for all the families in one simulation run. For small families, the mLRC score is typically lower than the LRC score when the LRC score is large. This is caused by the penalization of our new method due to lack of information in small families. Analogously, small families are weighted upwards when the LRC score is low following the same principle of major uncertainty when the family size is small. Still, if the level of exceptionality of the observed family members is large, small families can still outperform large families. This is illustrated by small families (for example, with Ni = 2, red dots) appearing at the right part of the graphic in Fig. 2. The ability of mLRC to correctly deal with differences in family size, explains that the association between family size and the mLRC score is very low (right column Table 1).

Comparison of LRC and mLRC with simulated data. For each of the N = 1000 families in one simulation run, we display the LRC score (x-axis) against the mLRC score (y-axis). Every point in the graphic represents a family, colored according to its size. Red dots represent families of size Ni = 2, light blue dots represent families of size Ni = 3, dark blue dots represent families of size Ni = 8, grey dots represent families of size Ni = 10 and black dots represent families of size Ni = 14
To evaluate the performance of selection rules based on the LRC and mLRC scores, we considered two definitions of longevity. First, the 10% of families with the lowest value of the random effect u were defined as truly long-lived. Second, we considered the 5% of families with the lowest value of the random effect u as truly long-lived. For both definitions, we checked the agreement between the truly long-lived families and the selected families based on the LRC and mLRC scores. To perform this selection, the families with the 10% (respectively 5%) largest LRC or mLRC score were labeled as long-lived. Since our main interest was to avoid families not enriched for longevity in our selection, we used the positive predictive value (PPV) as summary measure of our simulations. The PPV is defined as the proportion of truly long-lived families among those classified as long-lived using the score-based selection rule under investigation.
Figure 3 shows the distribution of the positive predictive values from the 1000 simulation runs. When defining the 10% of families with the lowest value of the random effect u as truly long-lived (left panel of Fig. 3), the mean PPV for the selection based on LRC was 54% (sd = 4%), meaning that on average, among the 1000 top 10% families classified as long-lived according to LRC, 54% were truly long-lived. The mean PPV increased to 62% (sd = 4%) when using mLRC for selection of the top 10% families. If we focus on the top 5% families (right panel of Fig. 3), the average accuracy of the selection based on LRC decreased (mean PPV = 0.52,sd = 0.13). In addition, we found large variability of the PPV among simulation runs, which indicates instable performance of the LRC score. On the contrary, the accuracy based on mLRC increased in this case (mean PPV = 0.67, sd = 0.06). These results show that selection of families based on mLRC clearly outperforms selection based on LRC.
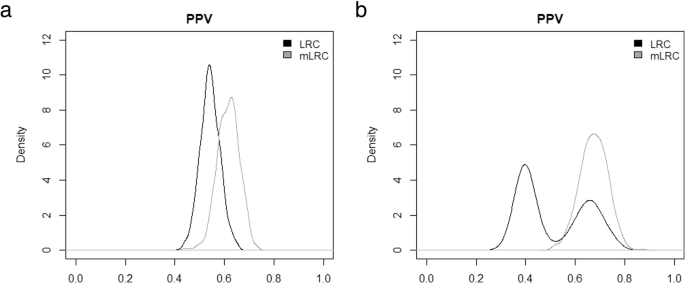
Evaluation of LRC and mLRC as selection tools with simulated data. Distribution of positive predictive (PPV) values across 1000 simulation runs. For each simulation run, the PPV associated to the selection rule under investigation was computed. Black lines represent the results based on LRC and grey lines represent the results based on mLRC. The left panel shows the results when defining the 10% of families with the lowest value of the random effect u as truly long-lived and the selection criterion is declaring families with the 10% largest values of the score as long-lived. The right panel shows the results for the more strict definition of longevity, based on the 5% lowest values of the random effect u and the selection criterion is declaring families with the 5% largest values of the score as long-lived
Real data: the historical sample of the Netherlands
The Historical Sample of the Netherlands (HSN) Long Lives study [27, 28] is an extensive database which contains lifetime data for the members of 1326 five-generational families, evolving around a single proband (Index Person, IP) per family [29]. We focus on the siblings present in the second (F2) generation which are the children of the IPs. The selection for a part of these IPs was enriched for longevity. Specifically, the selected IPs were part of a case-control study to compare differences in longevity among descendants of 884 IPs who died at 80 years or beyond (case group) and 442 IPs who died between 40 and 59 years (control group) [18, 30]. After removing individuals with missing age at death, single child sibships, and individuals belonging to non-extinct birth cohorts by the date of data collection (death dates were updated at 2017 and 110 years was set as maximum age); the final sample of our analysis consisted of 1105 sibships, children of the aforementioned HSN IPs, which corresponded to 5361 individuals.
To evaluate the performance of the new longevity family score mLRC and compare it to the original LRC, we first randomly selected a sample of independent individuals by choosing one individual at random from each of the 1105 available sibships. This set of independent individuals was set aside from the score calculations and subsequently used as a validation set to evaluate score performance. This validation set resembles the potential candidates to be included in, for example, a GWA study of longevity. Then, LRC and mLRC were calculated based on a sample of 4256 individuals. Afterwards, based on both scores we conducted a selection of long-lived families and we checked if those corresponded with a survival benefit in the validation set using Cox proportional hazard regression.
The sibship size was highly varying in the sample (Fig. 4). As expected, LRC is largely affected by family size, and families with large values of LRC present lower sibship sizes (Table 2). We do not observe a pattern in family size according to the estimated level of familiar longevity using mLRC. Figure 5 shows the distribution of the LRC and mLRC scores in the analyzed sibships of the HSN dataset.
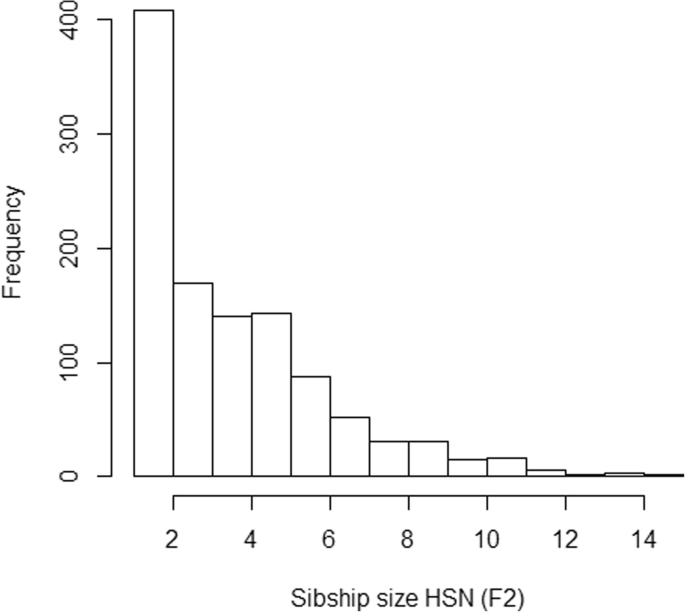
Sibship size in the HSN data
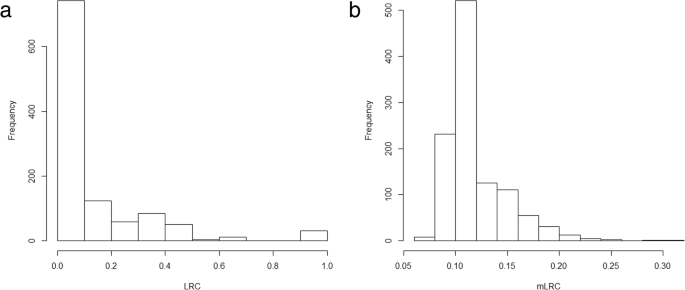
Distribution of the LRC (left panel) and mLRC (right panel) scores in the analyzed sibships of the HSN dataset
Previous literature [18], has suggested LRC ≥ 0.3 as a selection criterion to capture the heritable longevity trait. In our sample, LRC ≥ 0.3 corresponds to the selection of the 15% families with the largest values of the LRC score. We evaluated the performance of this selection criterion by comparing the survival of the individuals of the validation set belonging the selected families to the rest of individuals in the validation set. Analogously, we selected the top 15% families according to ranking resulting from using the mLRC as longevity score which corresponds to define families with mLRC ≥ 0.15 as long-lived and evaluated this selection strategy using the validation set. For each of the proposed selections, we fitted a Cox regression model with the each of the selection indicators as explanatory variables. Both models were adjusted by gender and birth cohort. Table 3 shows that the selection of long-lived individuals based on the mLRC score predicts excess survival in the validation set better than the selection based on the LRC score (βLRC ≥ 0.3 = − 0.287, βmLRC ≥ 0.15 = − 0.321).
Discussion
We proposed a method based on mixed effects regression modelling to estimate longevity family scores and properly account for differences in family size when ranking families according to their longevity and use this ranking for the selection of participants in longevity studies. Our simulation study and real data analysis show that the new proposed approach (mLRC) yields better results than its empirical counterpart (LRC) in terms of selection of long-lived individuals. We showed that the SEf score and FLoSS increase with the addition of non-long-lived family members and their interpretation is ruled by the underlying family size distribution. We also showed that the LRC score puts too much weight on small, less-informative families. The mLRC score was not affected by sibship size and therefore its resulting ranking better predicted the survival of 1105 independent study participants. The new mLRC score seems to reduce heterogeneity in the selection of families and its application could potentially help to improve power and bias reduction in longevity studies.
Our current approach has some limitations. First, the binary nature of the current mLRC discards important information which could contribute to improve its performance. An interesting property of the SEf score and the FLoSS is their continuous nature. Other continuous longevity family scores have been previously proposed [4, 24, 25]. The Longevity Family Score (LFS) [4] and the Family Mortality History Score (FMHS) [25] are closely related to the SEf and FLoSS since all use the same measure of individual survival exceptionality based on transforming the observed ages at death to survival percentiles in a reference population using life tables. The FMHS is restricted to parental data and hence not subject to differential family size. The LFS, the SEf and the FLoSS are extensions of the FMHS which can deal with sibships of arbitrary size. The Familial Excess Longevity (FEL) score [24] is also continuous but it does rely on population life tables. Instead, individual survival exceptionality is defined as the difference between observed and expected age, derived from an accelerated failure time regression model. Both the LFS and the FEL scores are based on the mean as family-specific summary measure and hence share with the LRC score the discussed limitations of empirical expectations.
A potential drawback of all these continuous longevity scores is that relatively young family members can contribute positively to these scores. Even after conditioning on being older than 40 as proposed for the FLoSS, the resulting score is probably influenced by ages at death which are not extreme enough to capture the heritable longevity trait. Evidence of this is supported by studies that have pointed towards increasing family aggregation of survival when focusing on more extreme ages at death for longevity definition [13, 31] and recent publications indicating that the longevity trait seems to be heritable considering lifespan thresholds beyond the top 10% survivors of a given birth cohort [5]. A model-based modified version of SEf or the LFS which minimizes the contribution of young family members seems a promising line of future research. However, the extremely skewed distribution of the individual measure of longevity of these scores makes the extension of our method not straightforward.
Another important topic is dealing with alive or lost on follow-up (right censored) individuals when constructing longevity family scores. We have assumed full observation of lifespan of siblings included in the calculation of the score, so scores can be regarded as family history scores of alive relatives who could potentially be selected to participate in a (genetic) longevity study.
The FLoSS score is the extension of the discussed score SEf to allow for the inclusion of right censored observations. The FLoSS follows a single imputation approach based on imputing alive individuals with the sex and birth cohort specific conditional expected age at death. This is an example of single imputation which underestimates the uncertainty of estimates and can potentially lead to bias. More advanced methods are possible in the mixed effect setting and its inclusion is left as subject of future research. Finally, recent evidence [9] indicates that the inclusion of family members of different degree of relatedness is of great importance to capture the heritable longevity phenotype and hence the proposed method should also be extended to this more complex setting.
Finally, it is important to mention that our approach may result in selections that are influenced by family-shared non-genetic factors. Despite previous research based on historical pedigree data have led to little evidence for associations between non-genetic factors such as socio-economic status, fertility factors or religious denomination and familial longevity [5, 8,9,10], other socio-behavioral and environmental factors such as personality and lifestyle may influence familial clustering of longevity. Since many of these also have a strong genetic component itself it is most likely that gene environmental interactions can explain a part of the familial clustering of longevity. Still in this complex setting, the use of well-designed family scores is expected to reduce genetic heterogeneity and contribute to a power increase in case-control longevity studies to detect novel genetic loci. Moreover, our mLRC score can be applied in more general longevity studies devoted to investigate the interplay among genetic and non-genetic factors involved in longevity.
Conclusions
To properly account for differences in family size is of paramount importance when deriving family scores of longevity and using them for ranking families and selecting participants in longevity studies. The methodology described in this paper is therefore of great relevance and can help to improve selection of participants in future longevity studies.
Availability of data and materials
The data used for this study will be made freely available at the Data Archiving and Networked Services (DANS) repository but are currently not yet publicly available due to ongoing checks to guarantee that the data sharing process is in accordance with Dutch and international privacy legislation. Data are however available from the authors upon reasonable request.
Abbreviations
- FLoSS:
-
Family Longevity Selection Score
- FMHS:
-
Family Mortality History Score
- HSN:
-
Historical Sample of the Netherlands
- IP:
-
Index person
- LFS:
-
Longevity Family Score
- LRC:
-
Longevity Relatives Count
- mLRC:
-
model-based Longevity Relatives Count
- PPV:
-
Positive predictive value
- SEf :
-
Survival Exceptionality
- Sd:
-
Standard deviation
References
van den Berg N, Beekman M, Smith KR, Janssens A, Slagboom PE. Historical demography and longevity genetics: Back to the future. Ageing Res Rev. 2017;38:28–39.
Herskind AM, et al. The heritability of human longevity: a population-based study of 2872 Danish twin pairs born 1870–1900. Hum Genet. 1996;97:319–23.
Perls TT, et al. Life-long sustained mortality advantage of siblings of centenarians. Proc Natl Acad Sci. 2002;99:8442–7.
van den Berg N, et al. Longevity around the turn of the 20th century: life-long sustained survival advantage for parents of Today’s nonagenarians. J Gerontol Ser A. 2018;73:1295–302.
van den Berg N, et al. Longevity defined as top 10% survivors and beyond is transmitted as a quantitative genetic trait. Nat Commun. 2019;10:35.
Schoenmaker M, et al. Evidence of genetic enrichment for exceptional survival 595 using a family approach: the Leiden longevity study. Eur J Hum Genet. 2006;14:79–84.
Ljungquist B, Berg S, Lanke J, McClearn GE, Pedersen NL. The effect of genetic 597 factors for longevity: a comparison of identical and fraternal twins in the Swedish 598 twin registry. J Gerontol Ser A Biol Sci Med Sci. 1998;53:441–6.
You D, Danan G, Yi Z. Familial transmission of human longevity among the oldest-old in China. J Appl Gerontol. 2010;29:308–32.
Gavrilov LA, Gavrilova NS. Predictors of exceptional longevity: effects of early-life and midlife conditions, and familial longevity. North Am Actuar J. 2015;19:174–86.
Mourits RJ, et al. Intergenerational transmission of longevity is not affected by other familial factors: evidence from 16,905 Dutch families from Zeeland, 1812-1962. Hist Fam. 2020;25:484–526.
Deelen J, et al. A meta-analysis of genome-wide association studies identifies multiple longevity genes. Nat Commun. 2019;10:3669.
Shadyab AH, LaCroix AZ. Genetic factors associated with longevity: a review of 615 recent findings. Ageing Res Rev. 2015;19:1–7.
Slagboom EP, van den Berg N, Deelen J. Phenome and genome based 617 studies into human ageing and longevity: an overview. Biochim Biophys Acta Mol Basis Dis. 1864;2018:2742–51.
Deelen J, et al. Genome-wide association meta-analysis of human longevity 620 identifies a novel locus conferring survival beyond 90 years of age. Hum Mol Genet. 2014;23:4420–32.
Sebastiani P, et al. Four genome-wide association studies identify new 635 extreme longevity variants. J Gerontol A Biol Sci Med Sci. 2017;72:1453–64.
Flachsbart F, et al. Immunochip analysis identifies association of the 637 RAD50/IL13 region with human longevity. Aging Cell. 2016;15:585–8.
Zeng Y, et al. Novel loci and pathways significantly associated with longevity. Sci Rep. 2016;6:21243.
van den Berg N, et al. Longevity Relatives Count score defines heritable longevity carriers and suggest case improvement in genetic studies. Aging Cell. 2020;19:e13139.
Sebastiani P, Nussbaum L, Andersen SL, Black MJ, Perls TT. Increasing Sibling Relative Risk of Survival to Older and Older Ages and the Importance of Precise Definitions of “Aging,” “Life Span,” and “Longevity”. J Gerontol Ser A Biol Sci Med Sci. 2016;71:340–6.
Oeppen J, Vaupel J. W. Demography. Broken limits to life expectancy. Science. 2002;296:1029–31.
Liu JZ, Erlich Y, Pickrell JK. Case–control association mapping by proxy using family history of disease. Nat Genet. 2017;49:325–31 https://doi.org/10.1038/ng.3766.
Hujoel MLA, Gazal S, Loh P, Patterson N, Price AL. Liability threshold modeling of case-control status and family history of disease increases association power. Nat Genet. 2020;52:541–7.
Sebastiani P, et al. A family longevity selection score: ranking Sibships by their longevity, size, and availability for study. Am J Epidemiol. 2009;170:1555–62.
Kerber RA, Brien EO, Smith KR, Cawthon RM. Familial excess longevity in Utah genealogies. J Gerontol Ser A Biol Sci Med Sci. 2001;56:130–9.
Rozing MP, Houwing-Duistermaat JJ, Slagboom PE, et al. Familial longevity is associated with decreased thyroid function. J Clin Endocrinol Metab. 2010;95:4979–84.
van der Meulen A. Life tables and survival analysis. Tech report. The Netherlands: CBS; 2012. https://www.cbs.nl/NR/rdonlyres/C047245B-B20E-492D-A4119F298DE7930C/0/2012LifetablesandSurvivalanalysysart.pdf.
Mandemakers K. Historical sample of the Netherlands. In: Hall PK, McCaa R, Thorvaldsen G, editors. Handbook of International Historical Microdata for Population Research; 2000. p. 149–77.
van den Berg N, et al. Families in comparison: an individual-level comparison of life course and family reconstructions between population and vital event registers. SocArXiv. 2018. https://osf.io/preprints/socarxiv/h2w8t/.
Mandemakers, K. 2010. https://socialhistory.org/en/hsn/hsn-releases. HSN 2010.01 release.
Mandemakers K, Munnik C. Historical Sample of the Netherlands. Project Genes, Germs and Resources. Dataset LongLives. Release 2016.01. International Institute of Social History. https://pure.knaw.nl/portal/en/datasets/historical-sample-of-the-netherlands-project-genes-germs-and-reso.
Gavrilova NS, Gavrilov LA. When does human longevity start?: demarcation of the boundaries for human longevity. Rejuvenation Res. 2001;4:115–24.
Acknowledgements
Not applicable.
Funding
Mar Rodríguez-Girondo has received financial support from MTM2017–89422-P (MINECO/AEI/FEDER,UE) project. The funders had no role in study design, data collection and analysis, decision to publish, or preparation of the manuscript.
Author information
Authors and Affiliations
Contributions
M.R.G. and M.H.P.H. conceived the new mLRC method. M.R.G. performed the computations and data analysis. N.v.d.B. preprocessed real data and participated in real data analysis. M.B. and E.P.S. supervised the findings of this work. All authors discussed the results and contributed to the final manuscript. The author(s) read and approved the final manuscript.
Corresponding author
Ethics declarations
Ethics approval and consent to participate
No permission from the ethical medical commission was required to collect and analyzed the HSN data. The authors got formal permission to analyze and publish the data from the International Institute for Social History (IISG).
Consent for publication
Not applicable.
Competing interests
The authors declare that they have no conflict of interest.
Additional information
Publisher’s Note
Springer Nature remains neutral with regard to jurisdictional claims in published maps and institutional affiliations.
Supplementary Information
Rights and permissions
Open Access This article is licensed under a Creative Commons Attribution 4.0 International License, which permits use, sharing, adaptation, distribution and reproduction in any medium or format, as long as you give appropriate credit to the original author(s) and the source, provide a link to the Creative Commons licence, and indicate if changes were made. The images or other third party material in this article are included in the article's Creative Commons licence, unless indicated otherwise in a credit line to the material. If material is not included in the article's Creative Commons licence and your intended use is not permitted by statutory regulation or exceeds the permitted use, you will need to obtain permission directly from the copyright holder. To view a copy of this licence, visit http://creativecommons.org/licenses/by/4.0/. The Creative Commons Public Domain Dedication waiver (http://creativecommons.org/publicdomain/zero/1.0/) applies to the data made available in this article, unless otherwise stated in a credit line to the data.
About this article

Cite this article
Rodríguez-Girondo, M., van den Berg, N., Hof, M.H. et al. Improved selection of participants in genetic longevity studies: family scores revisited. BMC Med Res Methodol 21, 7 (2021). https://doi.org/10.1186/s12874-020-01193-7
Received:
Accepted:
Published:
DOI: https://doi.org/10.1186/s12874-020-01193-7