- Research
- Open access
- Published:
Identification of causal effects in case-control studies
BMC Medical Research Methodology volume 22, Article number: 7 (2022)
Abstract
Background
Case-control designs are an important yet commonly misunderstood tool in the epidemiologist’s arsenal for causal inference. We reconsider classical concepts, assumptions and principles and explore when the results of case-control studies can be endowed a causal interpretation.
Results
We establish how, and under which conditions, various causal estimands relating to intention-to-treat or per-protocol effects can be identified based on the data that are collected under popular sampling schemes (case-base, survivor, and risk-set sampling, with or without matching). We present a concise summary of our identification results that link the estimands to the (distribution of the) available data and articulate under which conditions these links hold.
Conclusion
The modern epidemiologist’s arsenal for causal inference is well-suited to make transparent for case-control designs what assumptions are necessary or sufficient to endow the respective study results with a causal interpretation and, in turn, help resolve or prevent misunderstanding. Our approach may inform future research on different estimands, other variations of the case-control design or settings with additional complexities.
Introduction
In causal inference, it is important that the causal question of interest is unambiguously articulated [1]. The causal question should dictate, and therefore be at the start of, investigation. When the target causal quantity, the estimand, is made explicit, one can start to question how it relates to the available data distribution and, as such, form a basis for estimation with finite samples from this distribution.
The counterfactual framework offers a language rich enough to articulate a wide variety of causal claims that can be expressed as what-if statements [1]. Another, albeit closely related, approach to causal inference is target trial emulation, an explicit effort to mitigate departures from a study (the ‘target trial’) that, if carried out, would enable one to readily answer the causal what-if question of interest [2]. While it may be too impractical or unethical to implement, making explicit what a target trial looks like has particular value in communicating the inferential goal and offers a reference against which to compare studies that have been or are to be conducted.
The counterfactual framework and emulation approach have become increasingly popular in observational cohort studies. Case-control studies, however, have not yet enjoyed this trend. A notable exception is given by Dickerman et al. [3], who recently outlined an application of trial emulation with case-control designs to statin use and colorectal cancer.
In this paper, we give an overview of how observational data obtained with case-control designs can be used to identify a number of causal estimands and, in doing so, recast historical case-control concepts, assumptions and principles in a modern and formal framework.
Preliminaries
Identification versus estimation
An estimand is said to be identifiable if the distribution of the available data is compatible with exactly one value of the estimand, or therefore, if the estimand can be expressed as a functional of the available data distribution. Identifiability is a relative notion as it depends on which data are available as well as on the assumptions one is willing to make. Identification forms a basis for estimation with finite samples from the available data distribution [4]. Once the estimand has been made explicit and an identifying functional established, estimation is a purely statistical problem. While the identifying functional will often naturally translate into a plug-in estimator, there is, however, generally more than one way to translate an identifiability result into an estimator and different estimators may have important differences in their statistical properties. Moreover, while the estimand may be identifiable, there need not exist an estimator with the desired properties (see e.g. [5]). Here, our focus is on identification, so that the purely statistical issues of the next step in causal inference, estimation, can be momentarily put aside.
Case-control study nested in cohort study
To facilitate understanding, it is useful to consider every case-control study as being “nested” within a cohort study. A case-control study could be considered as a cohort study with missingness governed by the control sampling scheme. Therefore, when the observed data distribution of a case-control study is compatible with exactly one value of a given estimand, then so is the available or observed data distribution of the underlying cohort study. In other words, identifiability of an estimand with a case-control study implies identifiability of the estimand with the cohort study within which it is nested (conceptually). The converse is not evident and in fact may not be true. In this paper, the focus is on sets of conditions or assumptions that are sufficient for identifiability in case-control studies.
Set-up of underlying cohort study
Consider a time-varying exposure Ak that can take one of two levels, 0 or 1, at K successive time points tk (k=0,1,...,K−1), where t0 denotes baseline (cohort entry or time zero). Study participants are followed over time until they sustain the event of interest or the administrative study end tK, whichever comes first. We denote by T the time elapsed from baseline until the event of interest and let Yk=I(T<tk) indicate whether the event has occurred by tk. The lengths between the time points are typically fixed at a constant (e.g., of one day, week, or month). Figure 1 depicts twelve equally spaced time points over, say, twelve months with several possible courses of follow-up of an individual. As the figure illustrates, individuals can switch between exposure levels during follow-up, as in any truly observational study. Apart from exposure and outcome data, we also consider a (vector of) covariate(s) Lk, which describes time-fixed individual characteristics or time-varying characteristics typically relating to a time window just before exposure or non-exposure at tk,k=0,1,...,K−1.
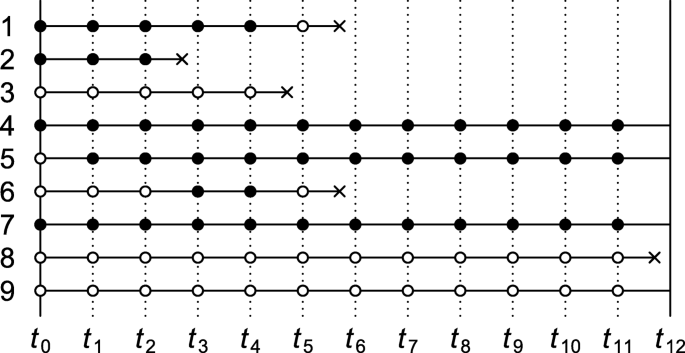
Illustration of possible courses of follow-up of an individual for a study with baseline t0 and administrative study end t12. Solid bullets indicate ‘exposed’; empty bullets indicate ‘not exposed’. The incident event of interest is represented by a cross
Causal contrasts
Although there are many possible contrasts, particularly with time-varying exposures, for simplicity we consider only two pairs of mutually exclusive interventions: (1) setting baseline exposure A0 to 1 versus 0; and (2) setting all of A0,A1,...,AK−1 to 1 (‘always exposed’) versus all to 0 (‘never exposed’). For a=0,1, we let counterfactual outcome Yk(a) indicate whether the event has occurred by tk under the baseline-only intervention that sets A0 to a. By convention, we write \(\overline {1}=(1,1,...,1)\) and \(\overline {0}=(0,0,...,0)\), and let \(Y_{k}(\overline {1})\) and \(Y_{k}(\overline {0})\) indicate whether the event has occurred by tk under the intervention that sets all elements of (A0,A1,...,AK−1) to 1 and all to 0, respectively. Further details about the notation and set-up are given in Supplementary Appendix A.
Case-control sampling
The fact that each time-specific exposure variable can take only one value per time point means that at most one counterfactual outcome can be observed per individual. This type of missingness is common to all studies. Relative to the cohort studies within which they are nested, case-control studies have additional missingness, which is governed by the control sampling scheme. In this paper, we focus on three well-known sampling schemes: case-base sampling, survivor sampling, and risk-set sampling. The next sections give an overview of conditions under which intention-to-treat and always-versus-never-exposed per-protocol effects can be identified with the data that are observed under these sampling schemes.
Case-control studies without matching
Table 1 summarises a number of identification results for case-control studies without matching. Each result consists of one of the three aforementioned sampling schemes, an estimand, a set of assumptions, and an identification strategy. Under the conditions of the “Sampling scheme” and “Assumptions” columns, an identifying functional of the estimand of the “Estimand” column is obtained by following the steps of the “Identification strategy” column. More formal statements and proofs are given in Supplementary Appendix B.
In all case-control studies that we consider in this section, cases are compared with controls with regard to their exposure status via an odds ratio, even when an effect measure other than the odds ratio is targeted. An individual qualifies as a case if and only if they sustain the event of interest by the administrative study end (i.e., YK=1) and adhered to one of the protocols of interest until the time of the incident event. In Fig. 1, the individual represented by row 1 is therefore regarded as a case (an exposed case in particular) in our investigation of intention-to-treat effects but not in that of per-protocol effects. Whether an individual (also) serves as a control depends on the control sampling scheme.
Case-base sampling
The first result in Table 1 describes how to identify the intention-to-treat effect as quantified by the marginal risk ratio
under case-base sampling. (For identification of a conditional risk ratio, see Theorem 2 of Supplementary Appendix B.) Case-base sampling, also known as case-cohort sampling, means that no individual who is at risk at baseline of sustaining the event of interest is precluded from selection as a control. Selection as a control, S, is further assumed independent of baseline covariate L0 and exposure A0. Selecting controls from survivors only (e.g., rows 4, 5, 7 and 9 in Fig. 1) violates this assumption when survival depends on L0 or A0.
To account for baseline confounding, inverse probability weights could be derived from control data according to
We then compute the odds of baseline exposure among cases and among controls in the pseudopopulation that is obtained by weighting everyone by subject-specific values of W. The ratio of these odds coincides with the target risk ratio under the three key identifiability conditions of consistency, baseline conditional exchangeability and positivity [1]. Consistency here means that for a=0,1,YK(a)=YK if A0=a, baseline conditional exchangeability that for a=0,1,A0 is independent of YK(a), and positivity that 0< Pr(A0=1|L0,S=1)<1.
The identification result for case-base sampling suggests a plug-in estimator: replace all functionals of the theoretical data distribution with sample analogues. For example, to obtain the weight for an individual with baseline covariate level l0, replace the theoretical propensity score Pr(A0=1|L0=l0,S=1) with an estimate \(\widehat {\Pr }(A_{0}=1|L_{0}=l_{0},S=1)\) derived from a fitted model (e.g., a logistic regression model) that imposes parametric constraints on the distribution of A0 given L0 among the controls.
Survivor sampling
With survivor (cumulative incidence or exclusive) sampling, a subject is eligible for selection as a control only if they reach the administrative study end event-free. To identify the conditional odds ratio of baseline exposure versus baseline non-exposure given L0,
selection as a control, S, is assumed independent of baseline exposure A0 given L0 and survival until the end of study (i.e., YK=0).
As is shown in Supplementary Appendix B, Theorem 3, the above odds ratio is identified by the ratio of the baseline exposure odds given L0 among the cases versus controls, provided the key identifiability conditions of consistency, baseline conditional exchangeability, and positivity are met.
All estimands in Table 1 describe a marginal effect, except for the odds ratio, which is conditional on baseline covariates L0. The corresponding marginal odds ratio
is not identifiable from the available data distribution under the stated assumptions (see remark to Theorem 3, Supplementary Appendix B). However, approximate identifiability can be achieved by invoking the rare event assumption (or rare disease assumption), in which case the marginal odds ratio approximates the marginal risk ratio.
Risk-set sampling for intention-to-treat effect
With risk-set (or incidence density) sampling, for all time windows [tk,tk+1),k=0,...,K−1, every subject who is event-free at tk is eligible for selection as a control for the period [tk,tk+1). This means that study participants may be selected as a control more than once.
Consider the intention-to-treat effect quantified by the marginal (discrete-time) hazard ratio (or rate ratio)
(For identification of a conditional hazard ratio, see Theorem 5, Supplementary Appendix B.) For identification of the above marginal hazard ratio under risk-set sampling, it is assumed that selection as a control between tk and tk+1,Sk, is independent of the baseline covariates and exposure given eligibility at tk (i.e., Yk=0). It is also assumed that the sampling probability among those eligible, Pr(Sk=1|Yk=0), is constant across time windows k=0,...,K−1. To this end, it suffices that the marginal hazard Pr(Yk+1=1|Yk=0) remains constant across time windows and that every kth sampling fraction Pr(Sk=1) is equal, up to a proportionality constant, to the probability Pr(Yk+1=1,Yk=0) of an incident case in the kth window (see remark to Theorem 4, Supplementary Appendix B). For practical purposes, this suggests sampling a fixed number of controls for every case from among the set of eligible individuals. To illustrate, consider Fig. 1 and note first of all that the individual represented by row 1 trivially qualifies as a case, because the individual survived until the event occurred. Because the event was sustained between t5 and t6, the proposed sampling suggests selecting a fixed number of controls from among those who are eligible at t5. Thus, rows (and only rows) 4 through 9 as well as row 1 itself in Fig. 1 qualify for selection as a control for this case. Even though the individual of row 1 is a case, the individual may also be selected as a control when the individuals of row 2, 3 and 6 (but not 8) sustain the event.
Once cases and controls are selected, we can start to derive inverse probability weights W according to Eq. 1 with S replaced with S0. We then compute the odds of baseline exposure among cases in the pseudopopulation that is obtained by weighting everyone by W and the odds of baseline exposure among controls weighted by W multiplied by the number of times the individual was selected as a control. The ratio of these odds coincides with the target hazard ratio under the three key identifiability conditions of consistency, baseline conditional exchangeability and positivity together with the assumption that the hazards in the numerator and denominator of the causal hazard ratio are constant across the time windows.
The consistency and exchangeability conditions are here slightly stronger than those of the previous subsections. Specifically, Theorem 4 (Supplementary Appendix B) requires consistency of the form: for all k=1,...,K and a=0,1,Yk(a)=Yk if A0=a. The exchangeability condition requires, for a=0,1, that conditional on L0, the counterfactual outcomes Y1(a),...,YK(a) are jointly independent of A0. The positivity condition takes the same form as in the previous subsections (i.e., 0< Pr(A0=a|L0,S0=1)<1).
Risk-set sampling for per-protocol effect
For the per-protocol effect quantified by the (discrete-time) hazard ratio (or rate ratio)
eligibility for selection as a control for the period [tk,tk+1) again requires that the respective subject is event-free at tk (i.e., Yk=0). Selection as a control between tk and tk+1,Sk, is further assumed independent of covariate and exposure history up to tk given eligibility at tk (but see Supplementary Appendix B for a slightly weaker assumption). As for the intention-to-treat effect, it is also assumed that the probability to be selected as a control Sk given eligibility is constant across time windows. This assumption is guaranteed to hold if the marginal hazard Pr(Yk+1=1|Yk=0) remains constant across time windows and that every kth sampling fraction Pr(Sk=1) is equal, up to a proportionality constant, to the probability of an incident case in the kth window. Figure 1 shows five incident events yet only three qualify as a case (rows 2, 3 and 8) when it concerns per-protocol effects. When the first case emerges (row 2), all rows meet the eligibility criterion for selection as a control. When the second emerges, the individual of row 2, who fails to survive event-free until t4, is precluded as a control. When the case of row 8 emerges, only the individuals of rows 4, 5, 7 and 9 are eligible as controls.
Once cases and controls are selected, we can start to derive time-varying inverse probability weights according to
It is important to note that the weights are derived from control information but are nonetheless used to weight both cases and controls [6]. The denominators of the weights describe the propensity to switch exposure level. However, once the weights are derived, every subject is censored from the time that they fail to adhere to one of the protocols of interest for all downstream analysis. The uncensored exposure levels are therefore constant over time. We then compute the baseline exposure odds among cases, weighted by the weights Wk corresponding to the interval [tk,tk+1) of the incident event (i.e., Yk=0,Yk+1=1), as well as the baseline exposure odds among controls, weighted by \(\sum _{k=0}^{K-1}W_{k}S_{k}\), the weighted number of times selected as control. The ratio of these odds equals the target hazard ratio under the three key identifiability conditions of consistency, sequential conditional exchangeability, and positivity together with the assumption that hazards in the numerator and denominator of the causal hazard ratio for the per-protocol effect are constant across the time windows. The consistency, exchangeability and positivity conditions take a somewhat different (stronger) form than in the previous subsections; we refer the reader to Supplementary Appendix A for further details.
Case-control studies with matching
Table 2 gives an overview of identification results for case-control studies with exact pair matching. Formal statements and proofs are given in Supplementary Appendix C, which also includes a generalisation of the results of Table 2 to exact 1-to-M matching. While the focus in this section is on exact covariate matching, for partial matching we refer the reader to Supplementary Appendix D, where we consider parametric identification by way of conditional logistic regression.
Pair matching involves assigning a single control exposure level, which we denote by A′, to every case. As for case-control studies without matching, in a case-control studies with matching an individual qualifies as a case if and only if they sustain the event of interest by the administrative study end (i.e., YK=1) and adhered to one of the protocols of interest until the time of the incident event. How a matched control exposure is assigned is encoded in the sampling scheme and the assumptions of Table 2. For example, for identification of the causal marginal risk ratio under case-base sampling, A′ is sampled from all study participants whose baseline covariate value matches that of the case, independently of the participants’ baseline exposure value and whether they survive until the end of study. The matching is exact in the sense that the control exposure information is derived from an individual who has the same value for the baseline covariate as the case.
The identification strategy is the same for all results listed in Table 2. Only the case-control pairs (A0,A′) with discordant exposure values (i.e., (1,0) or (0,1)) are used. Under the stated sampling schemes and assumptions, the respective estimands are identified by the ratio of discordant pairs.
Discussion
This paper gives a formal account of how and when causal effects can be identified in case-control studies and, as such, underpins the case-control application of Dickerman et al. [3]. Like Dickerman et al., we believe that case-control studies should generally be regarded as being nested within cohort studies. This view emphasises that the threats to the validity of cohort studies should also be considered in case-control studies. For example, in case-control applications with risk-set sampling, researchers often consider the covariate and exposure status only at, or just before, the time of the event (for cases) or the time of sampling (for controls). However, where a cohort study would require information on baseline levels or the complete treatment and covariate history of participants, one should suspect that this holds for the nested case-control study too. To gain clarity, we encourage researchers to move away from using person-years, -weeks, or -days (rather than individuals) as the default units of inference [7], and to realise that inadequately addressed deviations from a target trial may lead to bias (or departure from identifiability), regardless of whether the study that attempts to emulate it is a case-control or a cohort study [3].
What is meant by a cohort study differs between authors and contexts [8]. The term ‘cohort’ may refer to either a ‘dynamic population’, or a ‘fixed cohort’, whose “membership is defined in a permanent fashion” and “determined by a single defining event and so becomes permanent” [9]. While it may sometimes be of interest to ask what would have happened with a dynamic cohort (e.g., the residents of a country) had it been subjected to one treatment protocol versus another, the results in this paper relate to fixed cohorts.
Like the cohort studies within which they are (at least conceptually) nested, case-control studies require an explicit definition of time zero, the time at which a choice is to be made between treatment strategies or protocols of interest [3]. Given a fixed cohort, time zero is generally determined by the defining event of the cohort (e.g., first diagnosis of a particular disease or having survived one year since diagnosis). This event may occur at different calendar times for different individuals. However, while a fixed cohort may be ‘open’ to new members relative to calendar time, it is always ‘closed’ along the time axis on which all subject-specific time zeros are aligned.
In this paper, time was regarded as discrete. Since we considered arbitrary intervals between time points and because, in real-world studies, time is never measured in a truly continuous fashion, this does not represent an important limitation for practical purposes. It is however important to note that the intervals between interventions and outcome assessments (in a target trial) are an intrinsic part of the estimand that lies at the start of investigation. Careful consideration of time intervals in the design of the conceptual target trial and of the actual cohort or case-control study is therefore warranted.
We emphasize that identification and estimation are distinct steps in causal inference. Although our focus was on the former, identifying functionals often naturally translate into estimators. The task of finding the estimator with the most appealing statistical properties is not necessarily straightforward, however, and is beyond the scope of this paper.
We specifically studied two causal contrasts (i.e., pairs of interventions), one corresponding to intention-to-treat effects and the other to always-versus-never per-protocol effects of a time-varying exposure. There are of course many more causal contrasts, treatment regimes and estimands conceivable that could be of interest. We argue that also for these estimands, researchers should seek to establish identifiability before they select an estimator.
The conditions under which identifiability is to be sought for practical purposes may well include more constraints or obstacles to causal inference, such as additional missingness (e.g., outcome censoring) and measurement error, than we have considered here. While some of our results assume that hazards or hazard ratios remain constant over time, in many cases these are likely time-varying [10, 11]. There are also more case-control designs (e.g., the case-crossover design) to consider. These additional complexities and designs are beyond the scope of this paper and represent an interesting direction for future research.
The case-control family of study designs is an important yet often misunderstood tool for identifying causal relations [12–15]. Although there is much to be learned, we believe that the modern arsenal for causal inference, which includes counterfactual thinking, is well-suited to make transparent for these classical epidemiological study designs what assumptions are sufficient or necessary to endow the study results with a causal interpretation and, in turn, help resolve or prevent misunderstanding.
Availability of data and materials
Data sharing is not applicable to this article as no datasets were generated or analysed during the current study.
References
Hernán M, Robins J. Causal Inference: What If. Boca Raton: Chapman & Hall/CRC; 2020.
Hernán MA, Robins JM. Using big data to emulate a target trial when a randomized trial is not available. Am J Epidemiol. 2016; 183(8):758–64.
Dickerman BA, García-Albéniz X, Logan RW, Denaxas S, Hernán MA. Emulating a target trial in case-control designs: an application to statins and colorectal cancer. Int J Epidemiol. 2020; 49(5):1637–46.
Petersen ML, Van der Laan MJ. Causal models and learning from data: integrating causal modeling and statistical estimation. Epidemiol (Camb, Mass). 2014; 25(3):418.
Maclaren OJ, Nicholson R. Models, identifiability, and estimability in causal inference. In: 38th International Conference on Machine Learning. Workshop on the Neglected Assumptions in Causal Inference. ICML: 2021. https://sites.google.com/view/naci2021/home.
Robins JM. [Choice as an alternative to control in observational studies]: comment. Stat Sci. 1999; 14(3):281–93.
Hernán MA. Counterpoint: epidemiology to guide decision-making: moving away from practice-free research. Am J Epidemiol. 2015; 182(10):834–39.
Vandenbroucke JP, Pearce N. Incidence rates in dynamic populations. Int J Epidemiol. 2012; 41(5):1472–79.
Rothman KJ, Greenland S, Lash TL. Modern Epidemiology, Third edition. Philadelphia: Lippincott Williams & Wilkins; 2008.
Lefebvre G, Angers J-F, Blais L. Estimation of time-dependent rate ratios in case-control studies: comparison of two approaches for exposure assessment. Pharmacoepidemiol Drug Saf. 2006; 15(5):304–16.
Guess HA. Exposure-time-varying hazard function ratios in case-control studies of drug effects. Pharmacoepidemiol Drug Saf. 2006; 15(2):81–92.
Knol MJ, Vandenbroucke JP, Scott P, Egger M. What do case-control studies estimate? survey of methods and assumptions in published case-control research. Am J Epidemiol. 2008; 168(9):1073–81.
Pearce N. Analysis of matched case-control studies. BMJ. 2016; 352:i969.
Mansournia MA, Jewell NP, Greenland S. Case–control matching: effects, misconceptions, and recommendations. Eur J Epidemiol. 2018; 33(1):5–14.
Labrecque JA, Hunink MM, Ikram MA, Ikram MK. Do case-control studies always estimate odds ratios?. Am J Epidemiol. 2021; 190(2):318–21.
Acknowledgments
None declared.
Funding
RHHG was funded by the Netherlands Organization for Scientific Research (NWO-Vidi project 917.16.430). The content is solely the responsibility of the authors and does not necessarily represent the official views of the funding body.
Author information
Authors and Affiliations
Contributions
BBLPdV devised the project and wrote the manuscript and supplementary material with substantial input from RHHG, who supervised the project. The authors read and approved the final manuscript.
Corresponding author
Ethics declarations
Ethics approval and consent to participate
Not applicable.
Consent for publication
Not applicable.
Competing interests
The authors declare that they have no competing interests.
Additional information
Publisher’s Note
Springer Nature remains neutral with regard to jurisdictional claims in published maps and institutional affiliations.
Supplementary Information
Additional file 1
Supplementary material to ‘Identification of causal effects in case-control studies’.
Rights and permissions
Open Access This article is licensed under a Creative Commons Attribution 4.0 International License, which permits use, sharing, adaptation, distribution and reproduction in any medium or format, as long as you give appropriate credit to the original author(s) and the source, provide a link to the Creative Commons licence, and indicate if changes were made. The images or other third party material in this article are included in the article’s Creative Commons licence, unless indicated otherwise in a credit line to the material. If material is not included in the article’s Creative Commons licence and your intended use is not permitted by statutory regulation or exceeds the permitted use, you will need to obtain permission directly from the copyright holder. To view a copy of this licence, visit http://creativecommons.org/licenses/by/4.0/. The Creative Commons Public Domain Dedication waiver (http://creativecommons.org/publicdomain/zero/1.0/) applies to the data made available in this article, unless otherwise stated in a credit line to the data.
About this article

Cite this article
L. Penning de Vries, B.B., Groenwold, R.H.H. Identification of causal effects in case-control studies. BMC Med Res Methodol 22, 7 (2022). https://doi.org/10.1186/s12874-021-01484-7
Received:
Accepted:
Published:
DOI: https://doi.org/10.1186/s12874-021-01484-7